Machine Learning w/ Random Forests
This page documents the work I have done using machine learning for binary classification. Before I begin I will assume that the reader has a basic understanding of machine and knows about different practical applications for machine learning. As my first soiree into this new and exciting field of data analytics I went straight for the stock market… $$$$$. I chose to use the stock market as my dataset because of its abundance of metrics and various analytical approaches. In this demo I will explain how to create a python program for basic binary classification and how to use random forests to cluster similar data sets.
The technique described below is not to be used as a trading strategy.
So what is a random forest?
 It is a type of model used for machine learning, and it is essentially made up of different classification “trees”. Each tree will make it’s own decision and the average of all the trees in the forest become the overall classification.
Steps to Creating and Using Your Own Random Forest Model
1) Select some known samples to create a training set –
I used http://www.barchart.com/stocks/signals/bottom100?view=technical for stocks to “sell” and http://www.barchart.com/stocks/signals/top100?view=technical for stocks to buy. Once again this is not meant to be a trading strategy.
2) Extract features from training set
3) Use the extracted features to train a random forest classifier
Code
Feature Extractor
#!/usr/bin/python
import bs4
from yahoo_finance import Share
from optparse import OptionParser

'''
STEP #1 features_extract.py
('http://www.barchart.com/stocks/signals/top100')
('http://www.barchart.com/stocks/signals/bottom100')
'''
def get_stocks(request):
    dataset = list()
    soup = bs4.BeautifulSoup(request, "lxml")
    for tr in soup.find_all('tr', attrs = {'class':['']}):
        results = list()
        row = tr.get_text("|",strip=True)
        for col in row.split("|"):
            if col.find("%") > 0:
                if col.find(" Buy") > 0:
                    results.insert(0, 'Buy')
                elif col.find(" Sell") > 0:
                    results.insert(0, 'Sell')
            results.append(col)
        dataset.append(results[0:2])
    return dataset

def clean_values(value):
    if value != None:
        try:
            float(value)
        except:
            if value.find("M") > 0:
                value = str(1000000 * float(value.replace('M', '')))
            elif value.find("B") > 0:
                value = str(1000000000 * float(value.replace('B', '')))
    else:
        value = 0
    return str(value)

def get_features(symbol):
    results = list()
    try:
        yahoo = Share(symbol)
        results.append(yahoo.get_price())
        results.append(yahoo.get_change())
        results.append(yahoo.get_volume())
        results.append(yahoo.get_prev_close())
        results.append(yahoo.get_open())
        results.append(yahoo.get_avg_daily_volume())
        results.append(yahoo.get_market_cap())
        results.append(yahoo.get_book_value())
        results.append(yahoo.get_ebitda())
        results.append(yahoo.get_dividend_share())
        results.append(yahoo.get_dividend_yield())
        results.append(yahoo.get_earnings_share())
        results.append(yahoo.get_days_high())
        results.append(yahoo.get_days_low())
        results.append(yahoo.get_year_high())
        results.append(yahoo.get_year_low())
        results.append(yahoo.get_50day_moving_avg())
        results.append(yahoo.get_200day_moving_avg())
        results.append(yahoo.get_price_earnings_ratio())
        results.append(yahoo.get_price_earnings_growth_ratio())
        results.append(yahoo.get_price_sales())
        results.append(yahoo.get_price_book())
        results.append(yahoo.get_short_ratio())
        for i in range(0,len(results)):
            results[i] = clean_values(results[i])
        return results
    except:
        #print "%s not found" % (symbol)
        results = [0,0,0,0,0,0,0,0,0,0,0,0,0,0,0,0,0,0,0,0,0,0,0]
        return results

def main():

    with open('top.txt', 'r') as f:
        request_top = f.read()

    with open('bottom.txt', 'r') as f:
        request_bottom = f.read()

    parser = OptionParser()
    parser.add_option("-a",  action="store_true", dest="head", default="False")
    (options, args) = parser.parse_args()
    superset = list()
    superset.append(get_stocks(request_bottom))
    superset.append(get_stocks(request_top))
    if options.head == True:
        csv_header = "Disposition,symbol,price,priceChange,volume,prevClose,open,avgDailyVolume,marketCap,bookValue,ebitda,dividendShare,dividendYield,earningsShare,daysHigh,daysLow,yearHigh,yearLow,50dayMovingAvg,200dayMovingAvg,PEratio,PEgrowthRatio,salesPrice,bookPrice,shortRatio"
        print csv_header
    for datas in superset:
        for data in datas:
            for value in get_features(data[1]):
                data.append(value)
            print ','.join(data)

if __name__ == "__main__":
    main()
Build Random Forest Classifier
#!/usr/bin/python

'''
STEP #2 stockRate.py
'''

import pandas as pd
from sklearn.ensemble import RandomForestClassifier
from features_extract import get_features
from sys import argv
from sklearn.externals import joblib
import datetime

df = pd.read_csv("daily-classifiers.csv", header=0)

y = df.ix[:, 'Disposition']
X = df.ix[:, 2:]

###MODEL TRAINING###
#CREATE classifier - using the classifier of your choice
clf = RandomForestClassifier(n_estimators = 1000)
#AUTOTUNE the features to the labels
clf = clf.fit(X,y)

samples = dict()

with open('primary-stock-list.txt', 'r') as f:
    rows = f.readlines()
#Generate Master list of leaf node predictions for all samples
for symbol in rows:
    print symbol
    symbol = symbol.rstrip()
    X_new = [get_features(symbol)]
    #print symbol, clf.predict(X_new), clf.predict_proba(X_new)[0][0]
    samples['%s'%symbol] = clf.apply(X_new)[0]

d = datetime.date.today().strftime("%Y%m%d")
joblib.dump(clf, '%s-clf.pkl' % d, compress=1)
joblib.dump(samples, '%s-stock-leaf-nodes.pkl' % d , compress=1)
Using the Model for Binary Classification and Similarity Comparisons
#!/usr/bin/python

'''
STEP #3 stockRate-similar.py
'''

from sys import argv
from sklearn.externals import joblib
from sklearn.ensemble import RandomForestClassifier
from features_extract import get_features

def compare_leaf_nodes(query, leaf_nodes, query_leaf_nodes):
    results = dict()
    for key in leaf_nodes.keys():
        counter = 0.0
        for i in range(0, len(query_leaf_nodes)):
            if query_leaf_nodes[i] == leaf_nodes[key][i]:
                counter += 1
        similarity = counter/10.0
        results[key] = similarity
    return results

def get_similarity_to_training_set(query, leaf_nodes):
    results = dict()
    for key in leaf_nodes.keys():
        counter = 0.0
        for i in range(0,len(leaf_nodes[query])):
            if leaf_nodes[query][i] == leaf_nodes[key][i]:
                counter += 1
        similarity = counter/10.0
        results[key] = similarity
    return results

def main():
    query = argv[1]
    clf = joblib.load(argv[2])
    samples = joblib.load(argv[3])
    print "Query: %s"%argv[1]
    X_new = [get_features(query)]
    '''
    Basic Binary Classification
    Buy or Sell(based on the top and bottom 100 from barchart.com)
    '''
    print "\n############## Binary Classification ##############\n%s %s %s\n" % (query, clf.predict(X_new), clf.predict_proba(X_new)[0][0])
    #Similaritiy of a given training set samples to the rest of the training set samples
    training_set_similarities = get_similarity_to_training_set(query, samples)
    print "############## %s from %s Similarity To Training Samples from %s ##############" % (query, argv[3], argv[3])
    for i in training_set_similarities.keys():
        if training_set_similarities[i] >= 70.0:
            print "%s %s" % (i, training_set_similarities[i])
    #Similarity of query to the enitire training set
    query_similarity = compare_leaf_nodes(query, samples, clf.apply(X_new)[0])
    print "\n############## Current %s Data - Similarity to Samples from %s ##############" % (query, argv[3])
    for i in query_similarity.keys():
        if query_similarity[i] >= 70.0:
            print "%s %s" % (i, query_similarity[i])

if __name__ == "__main__":
    main()
Shell Script to Automate the Entire Model Building Process
#!/bin/bash

d=$(date +"%Y%m%d")

curl http://www.barchart.com/stocks/signals/top100?view=technical > top.txt
curl http://www.barchart.com/stocks/signals/bottom100?view=technical > bottom.txt
python features_extract.py >> $d-classifiers.out

cat header.txt > daily-classifiers.csv
ls 2016*-classifiers.out | grep -vF -e header -e daily | sort -nr | head -5 | xargs -I @ cat @ >> daily-classifiers.csv

python stockRate.py >> $d-rate-results.out
Demo Output Using Model from 20160111 on Stock Data for GOOG at Market Close of 20160816
$ ./stockRate-similar.py GOOG 20160111-clf.pkl 20160111-stock-leaf-nodes.pkl
Query: GOOG

############## Binary Classification ##############
GOOG ['Sell'] 0.274

############## GOOG from 20160111-stock-leaf-nodes.pkl Similarity To Training Samples from 20160111-stock-leaf-nodes.pkl ##############
AMZN 71.8
ISRG 73.2
GOOGL 98.7
GOOG 100.0

############## Current GOOG Data - Similarity to Samples from 20160111-stock-leaf-nodes.pkl ##############
PCLN 75.8
CMG 70.4
Demo Output Using Model from 20160815 on Stock Data for GOOG at Market Close of 20160816
$ ./stockRate-similar.py GOOG 20160816-clf.pkl 20160816-stock-leaf-nodes.pkl
Query: GOOG

############## Binary Classification ##############
GOOG ['Sell'] 0.416

############## GOOG from 20160816-stock-leaf-nodes.pkl Similarity To Training Samples from 20160816-stock-leaf-nodes.pkl ##############
BIIB 91.0
PCLN 86.0
SHPG 72.7
GOOGL 99.5
GOOG 100.0

############## Current GOOG Data - Similarity to Samples from 20160816-stock-leaf-nodes.pkl ##############
BIIB 89.7
PCLN 86.5
SHPG 71.6
GOOGL 98.6
GOOG 98.7
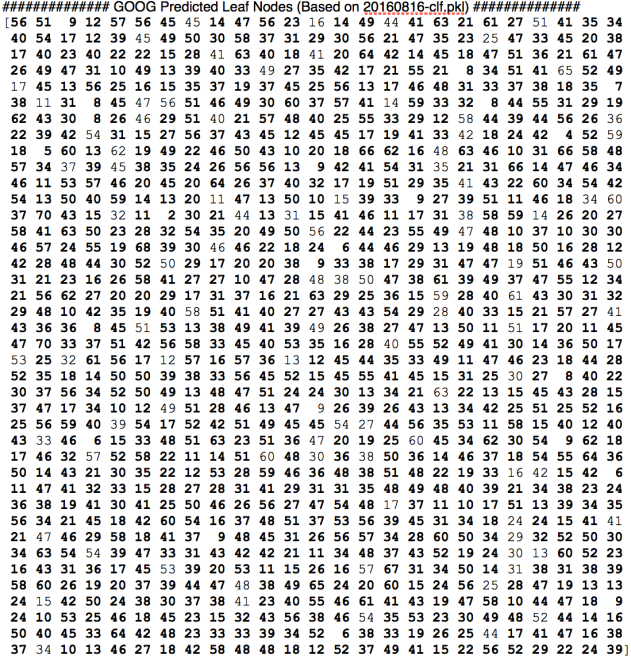
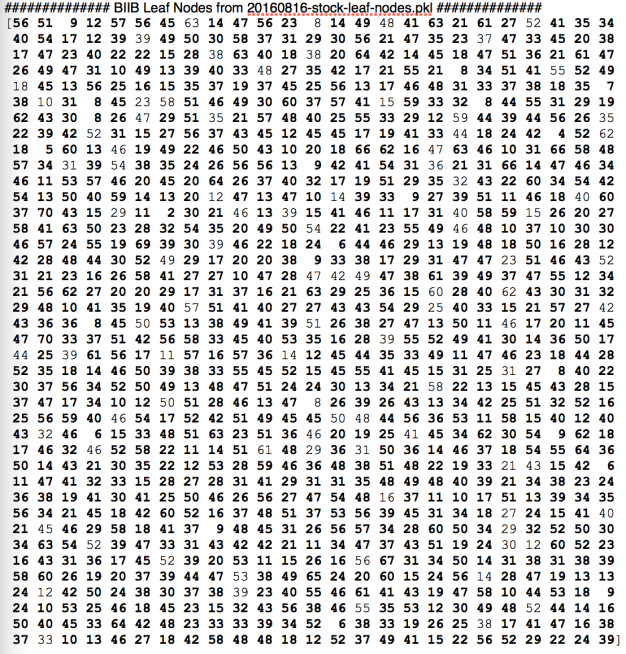
Showing How the Similarity Comparison Works – Compare the Leaf Nodes in Every Tree for a Query and a Given Sample (The Example Below is Highlighting the 89.7 Similarity Between GOOG and BIIB)
Bold Indicates Overlap Between the Two Samples